
I didn’t find this subject very easy to study. All the information is out there but, somehow, I always found it to be rather cryptic. I didn’t want to design one, just know what to shop for. Finally, I think I understand it and here’s how it makes sense to me. A picture is worth a thousand equations.
The Main Variables
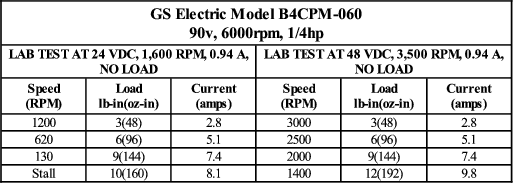
Fig. 9.2.1 Common Motor Specifications
The table in Fig. 9.2.1 shows some GS motor test data I found on the net. I used this to construct Fig. 9.2.2, a commonly-seen type of graph used to illustrate PMDC motor characteristics.
A Graphical Representation
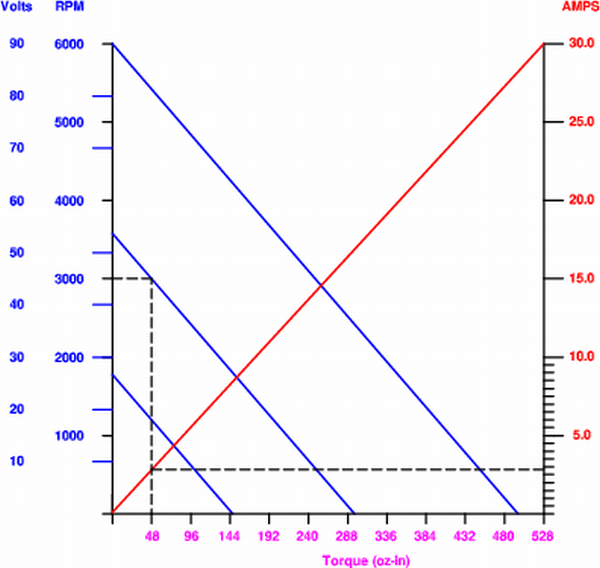
The diagonal blue lines show the RPM/torque relationship for each of the two test cases and, by extrapolation, that of the motor’s rated 6000 rpm no-load speed. The red line shows the current drain at each value of torque. The dotted line illustrates how to use the graph by showing one of the table entries:
Efficiency and Continuous Operation
There are two different ways of calculating horsepower from this data:
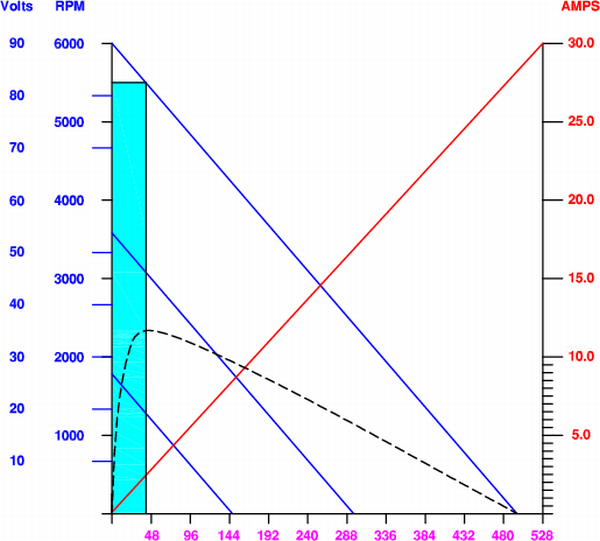
Fig. 9.2.3 Motor Efficiency and Continuous Operation Zone
For the above example:
The ratio of input to output power gives the efficiency at that power point: .143/.180 = 79%.
The input and output horsepowers vary greatly over the motor’s operating range and so does the efficiency. When plotted, the efficiency curves for all PMDC motors look pretty much like the dotted line in Fig. 9.2.3.
Continuous operation is largely determined by a motor’s ability to dissipate heat. At high efficiency it produces more power and less heat. So it’s not surprising to see that the continuous operation zone is closely related to the efficiency curve as shown by the coloured area in Fig. 9.2.3. We can only estimate but the graph implies that this motor’s rated continuous 1/4 horsepower is probably produced at roughly 5500 rpm drawing around 2.5 amps and producing about 46 0z-in of torque.
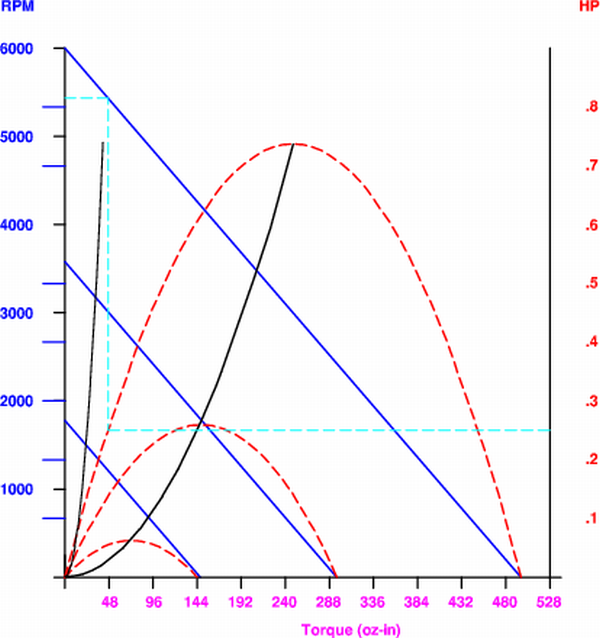
Fig. 9.2.4 Horsepower Decline
Power Variation with Speed
The theoretical maximum power of a PMDC motor occurs at half the no-load speed and is typically much higher than the continuous rated speed. In this case, that would be around 3/4 hp. It falls off parabolically at higher and lower speeds as shown by the dotted lines in Fig. 9.2.4 which represent three of the infinitely many voltage/torque power curves.
The solid black lines show the curve connecting the power levels as the speed is reduced. Both of these are also parabolic but it’s only obvious for the maximum values. The continuous range is so narrow that its curve might as well be a straight line. I’ve read that you can count on linear performance down to about 10% of the motor’s no-load speed.